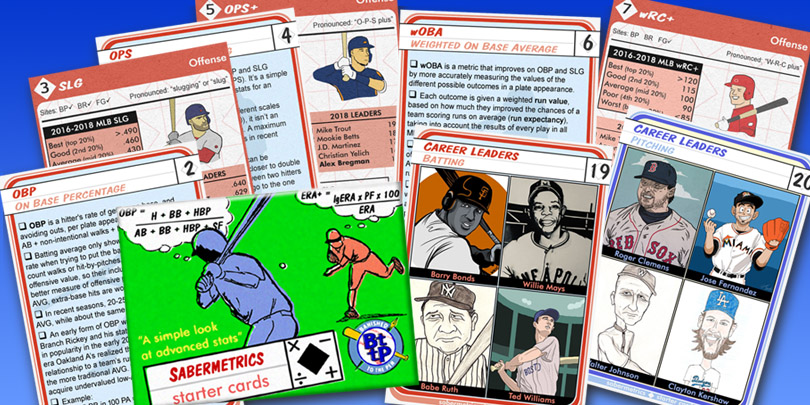
Presented here is a virtual baseball card series that aims to serve as an introduction to sabermetrics: Why is on base percentage better than batting average? What’s a good OPS? What does wRC+ mean?
Most entries consist of: a brief description, a “range table” that breaks down what’s good/average/bad, and top-five MLB leaderboards for the past two seasons. Simplified formulas are shown when possible. Also included is a list of which of the three leading sabermetrics sites (BP=Baseball Prospectus, BR=Baseball-Reference, FG=FanGraphs) use each particular stat in their leaderboards.
Cards #2-9 are available below, with a checklist (#1) and more being added in the future – currently slated for a total of 20.
Also featured are two career leader cards (#19 and #20), featuring works from various artists (click to enlarge):


Credits: kerowack (Bonds), Damian Schaab (Mays), Gummy Arts (Ruth & Johnson), Scott Brady (Williams & Fernandez), Antonio Losada (Clemens), Mark Mosley (Kershaw)
Click on card to open slideshow in full-screen view:
By Brandon Lee, Darius Austin, Ken Maeda.
Thanks to Rob Mains, Alex Crisafulli, Andrew Patrick, Daniel R Epstein, Eric Roseberry, Khurram Kalim, Mike Carlucci, Nick Strangis, and Scott Kushner for their contributions, feedback, and assistance.
Previous post: Casey at the Bat 2019: A Modern Retelling


Leave a Reply