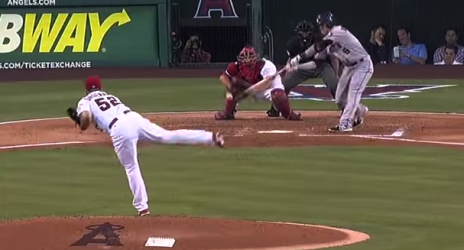
In this installment of “In-Season Scouting”, my amateurish attempt to evaluate players during the season, we will take a peek at Angels pitcher Matt Shoemaker. After a half cup of coffee in 2013, Shoemaker came up full-time in 2014 and had an outstanding year. So far Matt is off to a rather poor start to his 2015 season. Let’s figure out why and determine if he can turn it around.
To begin we should compare Shoemaker’s 2014 and 2015 pitching lines. This will give us a reference point as well as a clue as to where we should start. The 2013 season should not be considered since he was only involved in five innings that year. (Click images for full size.)

Looking at Shoemaker’s line we can see that only a couple of stats fall outside his accepted or predicted range. His BABIP, a statistic often determined to be the cause of an underperforming player, is actually lower than his predicted value for this year as well as the value from last year. The metric that looks the most troubling is the HR/FB mark. It is double what it was last year which would also explain why his HR/9 is out of control.
So giving up the long ball definitely seems like a possible answer as to why Shoemaker has struggled thus far. Now we need to determine the cause of this home run spike. The first thing that comes to mind is pitch velocity. Below is the percentage of pitch types thrown along with the average velocity of each for 2014 and 2015. Remember, disregard 2013.


Shoemaker’s average mix of pitches seems to be nearly the same from 2014 to 2015. The velocity on his fastball is down a little, but from my playing experience there is not much difference from seeing an 89 or 90 MPH fastball. I doubt this is the reason opposing batters are having an easier time hitting home runs.
Maybe movement is the answer. All of Matt’s pitches typically have good movement so a change in the movement of certain pitches could be the answer to the home run dilemma.

Looks to be mostly the same, but the movement on his changeup looks a little off compared to last season. It seems Shoemaker is not getting as much horizontal movement (xMov) this year on the changeup as he was in 2014. You might notice the knuckle curve xMov is quite a bit different from 2014 to 2015. For that pitch, the horizontal movement is going to be unstable. If you look at the vertical movement (zMov), you will see there is little change from last year.
Ok, so Shoemaker is giving up more home runs in 2015 and the changeup might be the culprit. To link the two together we need look no further than PitchF/X data relating to what pitch types rendered the most home runs against Shoemaker. The chart is revealing.

Eight of the thirteen home runs given up by Shoemaker in 2015 have come off his changeup. Hypothetically it would seem that opposing batters are sitting on that pitch more than any other Shoemaker throws. Tabular data at Brooks Baseball explains, to a certain extent, why this is happening. Important note before reviewing the chart; Brooks Baseball classifies Shoemaker’s changeup as a splitter and if you look at the grip and the spin, seen here, it is a splitter.

The chart can be a little confusing, but focus your attention on the splitter column. The table shows us that Shoemaker throws his splitter predominantly in counts where he is ahead especially if the batter has two strikes. However, in two strike counts he typically either throws a four-seam or his changeup/splitter. This is mostly irrelevant to hitters though. All they are concerned with is that they should look for the splitter if they are behind in the count.
Home runs off the splitter by count in 2015:
0-0 count: 2 home runs
Shoemaker ahead: 6 home runs
This has been a lot of analysis for one player, but I promise we are nearly done. To recap, we have determined the root of Matt Shoemaker’s struggles lie within his sudden knack for giving up the long ball. The increase in home runs seems to be primarily due to the inefficiency of his splitter, especially in counts where he is ahead. Two more comparison charts will hammer home this theory.


These charts are comparing the location of Shoemaker’s pitches when ahead in the count from 2014 to 2015. As you can see, in 2015 he has had some slight control issues when ahead in the count compared to 2014 where he was mainly keeping those pitches low in the zone. Brooks Baseball’s zone profile on Shoemaker confirms this pattern for his splitter as well.
Matt has already made some adjustments. In his last start, he did not alter the counts he was throwing his splitter on, but he was keeping the pitch down or out of the strike zone especially in favorable counts. I won’t bore you anymore with charts. You can go to Brooks Baseball yourself to verify, but of the fourteen splitters he threw in his last outing against San Diego, only six were located in the strike zone. In counts in which he was ahead in that game, he only threw one splitter in the zone and that one was low.
If Shoemaker can recognize the source of his problems he should be able to easily turn his season around. I still think he should do a little better job of mixing his pitches so as to not be so predictable, but if nothing else, managing his control in counts where he is ahead should limit the home runs going forward and ultimately improve his overall line.
Next post: Welcome, Sonoma Stompers Fans!Previous post: Creative Destruction in Baseball: A Deeper Look


Leave a Reply